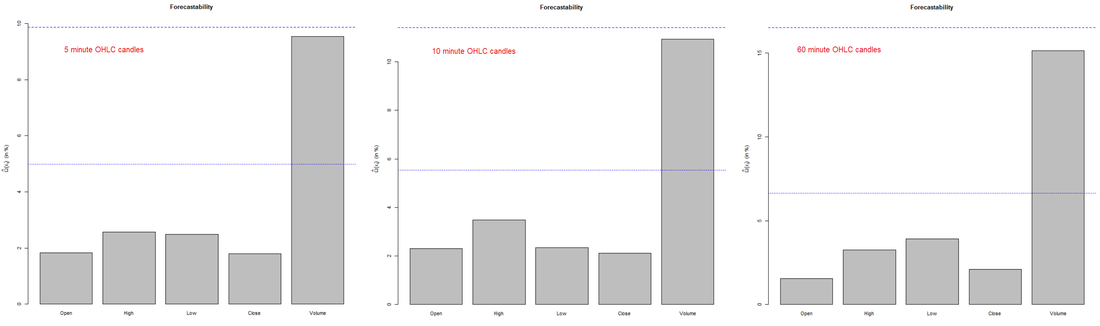
 Figure 1. Intraday forecastability analysis.
 Typically algorithmic traders attempt to leverage historical stock prices, price movements and functions of price or volume of trades, including Twitter or Stocktwits based sentiment to predict the direction of future stock prices. Such models are often supplemented by a money management strategy which is implemented in the form of a trade execution engine that uses the historical success of predictions made by a trained model or identified pattern to determine the amount of capital to invest (i.e. in the long or short direction) on future predictions. However, all inputs to an algorithmic trading model - machine learning based or simple pattern recognition - are not made equal. In this blog post, I example the forecast-ability of intraday and end-of-day candlesticks by examining open, high, low, close and volume data, independently as well as in combination.
The approach for this analysis was inspired by Goerg 2012 [1] which presents an adaptation of principal component analysis i.e. a novel dimension reduction technique for temporally dependent signals, utilizing a new forecastability measure, Omega. Omega is an uncertainty metric defined based on the Shannon entropy [2] of the Fourier transform of the autocovariance function of a given univariate time series (i.e. open, high, low, close or volume, in this study). In this manner, Omega therefore forms a quantitative means to separate a multivariate time series into a forecastable (Omega >> 0) and an orthogonal white noise space (i.e. Omega ~ 0). My analysis of SPY (S&P500 ETF) are presented below.
A look into 5, 10 and 60 minute intraday candlesticks of SPY between 1 Jan 2016 and 5 Feb 2016 led to a rather surprising revelation that intraday "volumes" are a better predictor of its future value than any of the other tested univariate time series' viz. open, high, low and close series'. Surprisingly, close prices - the often recommended gold-standard price that is supposedly least affected by end-effects, instabilities and such was found to be the "least" predictable series!
 Figure 2. EOD candlestick forecastability.
 Au contraire, and slightly disappointingly so, volume wasn't as forecastable and index using end-of-day (EOD) candlestick data (see Figure 2), while the relative ly poor predictability of close and adjusted-close prices didn't cease to disappoint!
As expected, confidence in the reported forecastability, as evidenced by the p-value for the reported series-specific Omega, reduced as the lag for time series forecasting incremented further and further into the future (owing to perhaps a lesser amount of data being available at 10x5 minute intervals than 1x5 minute intervals, for instance). That said, all reported Omega data in Figure 1 (i.e. 5, 10 and 60 minute intraday candlestick analysis) and Figure 2 (EOD candlestick analysis) were statistically significant.
Some lessons learned here, perhaps: a) Never underestimate the value of intraday candlesticks; and b) If you're an algorithmic traders attempting to leverage historical stock prices alone to predict prices, think again! Intraday volumes may serve your algorithm some pleasant surprises and improved predictive performance.
Also of interest might be that an analysis of FCX (Freeport McRoran) and WTI (i.e. a Crude Oil metric - W&T Offshore Inc.) revealed similar results except that WTI adjusted-close prices were classified (based on the Omega / entropy analysis) as "white noise"!
In principle, it is possible to leverage univariate Omega values as a maximizable objective function to design an optimal function of a time series (or a linear combination of time series') which are more forecastable than any independent univariate time series. Although this so-called optimal time series is likely to be highly stock and tick-interval / candlestick frequency specific, a truly forecastable truth is out there for every ticker!
Oh, and in case you were wondering what the "blue dotted / dashed lines" were on the plots in Figures 1 and 2 - they represent the heightened level of predictability (i.e. Omega) of a multi-variate index determined as a linear combination of open, high, low, close and volume and open, high, low and close, respectively. In my experiments, so far, a 60% to 70% improvement in predictibility is possible to achieve using a combination of the univariate variable which constitute a standard candlestick time-series dataset.
References:
[1] Goerg GM. Forecastable Component Analysis (ForeCA). arXiv preprint arXiv:1205.4591. 2012 May 21.
[2] Shannon, C. E. (1948). A Mathematical Theory of Communication. Bell System Technical Journal 27, 379–23, 623–656.

 RSS Feed
